



A snapshot of India’s merchandise and services trade performance for June 2026 and the first quarter of FY 2026-27, covering export winners, laggards and destination shifts.
India’s Trade Snapshot — June 2026
India’s total trade, merchandise and services combined, crossed $162 billion in June 2026 alone. Exports grew a healthy 9.48 per cent year on year to $73.45 billion, but imports outpaced them by a wide margin, rising 26.85 per cent to $88.76 billion. The gap between the two pushed the monthly trade deficit to $15.32 billion, more than five times the $2.89 billion deficit recorded in June last year.
| Category | June 2025 | June 2026 | % Change |
| Merchandise Exports | $34.98 bn | $40.41 bn | +15.52% |
| Merchandise Imports | $54.08 bn | $70.84 bn | +31.00% |
| Services Exports | $32.11 bn | $33.03 bn | +2.87% |
| Services Imports | $15.90 bn | $17.92 bn | +12.70% |
| Total Exports (M+S) | $67.09 bn | $73.45 bn | +9.48% |
| Total Imports (M+S) | $69.98 bn | $88.76 bn | +26.85% |
| Trade Balance (M+S) | -$2.89 bn | -$15.32 bn | Deficit Widened |
India’s Trade Snapshot — Q1 FY 2026-27 (April-June)
The quarterly picture confirms the trend is not a one-month blip. Across April to June 2026-27, India’s total exports rose 11.37 per cent to $232.73 billion while imports climbed a sharper 17.55 per cent to $270.15 billion. The quarterly trade deficit nearly doubled, from $20.85 billion in the same period last year to $37.42 billion this year. Merchandise exports were the standout performer, up 15.92 per cent, but merchandise imports rose nearly as fast at 19.90 per cent, keeping the overall gap wide.
| Category | Apr-Jun 2025-26 | Apr-Jun 2026-27 | % Change |
| Merchandise Exports | $111.57 bn | $129.32 bn | +15.92% |
| Merchandise Imports | $180.31 bn | $216.18 bn | +19.90% |
| Services Exports | $97.41 bn | $103.41 bn | +6.16% |
| Services Imports | $49.51 bn | $53.97 bn | +9.01% |
| Total Exports (M+S) | $208.98 bn | $232.73 bn | +11.37% |
| Total Imports (M+S) | $229.82 bn | $270.15 bn | +17.55% |
| Trade Balance (M+S) | -$20.85 bn | -$37.42 bn | Deficit Widened |
Top Export Sectors by Growth — June 2026
Nineteen commodity categories posted positive growth in June 2026, and the spread was unusually broad. Other Cereals led every category by a wide margin, up 244.29 per cent, followed by strong gains in handicrafts, meat and dairy products, and iron ore. Gems and jewellery, India’s most closely watched trade-sensitive sector, grew 34.64 per cent to $2.41 billion, while engineering goods, the country’s largest export category by absolute value, rose 20.74 per cent to $11.48 billion. Electronics, chemicals and rice all posted double-digit growth as well, pointing to genuine breadth rather than a single sector carrying the numbers.
| # | Sector | YoY Growth | Value June 2026 |
| 1 | Other Cereals | +244.29% | High growth |
| 2 | Handicrafts (Excl. Hand Made Carpet) | +59.69% | High growth |
| 3 | Meat, Dairy and Poultry Products | +54.63% | High growth |
| 4 | Iron Ore | +49.97% | High growth |
| 5 | Gems and Jewellery | +34.64% | $2.41 bn |
| 6 | Engineering Goods | +20.74% | $11.48 bn |
| 7 | Organic and Inorganic Chemicals | +19.42% | $2.77 bn |
| 8 | Electronic Goods | +18.93% | $4.93 bn |
| 9 | Rice | +16.48% | $1.00 bn |
Import Categories in Decline — June 2026
Not every import category moved in the same direction. Five categories recorded outright declines in June 2026, led by an 85.44 per cent collapse in Project Goods imports and a 73.62 per cent fall in silver imports. Pearls, precious and semi-precious stones, chemical materials and vegetable oil all posted smaller but consistent year-on-year declines, suggesting some easing in commodity-linked import demand even as overall imports surged.
| Import Category | YoY Change |
| Project Goods | -85.44% |
| Silver | -73.62% |
| Pearls, Precious and Semi-Precious Stones | -16.83% |
| Chemical Material and Products | -12.13% |
| Vegetable Oil | -2.58% |
Where India Traded Fastest — June 2026
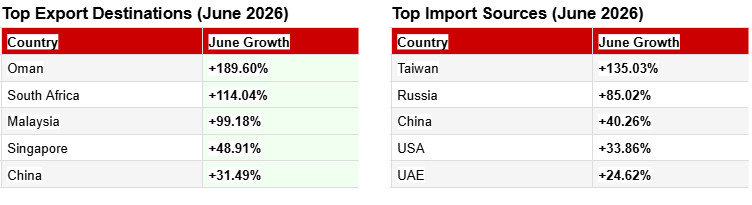
India’s export growth was sharpest toward destinations outside its traditional top markets. Oman posted the single largest jump at 189.60 per cent, followed by South Africa, Malaysia, Singapore and China, all recording growth above 30 per cent. On the import side, the picture was different: growth was concentrated among established trading partners, with Taiwan, Russia, China, the USA and the UAE all posting sharp increases, reflecting India’s deepening reliance on these markets for inputs, electronics and energy-linked commodities.
The Takeaway
India’s trade in June 2026 tells a story of accelerating growth on both sides of the ledger. Merchandise exports rose 15.92 per cent in Q1 FY27, driven by a broad-based rally across cereals, handicrafts, meat and dairy, iron ore, gems and jewellery, engineering goods and electronics. But imports grew faster still, up 17.55 per cent for the quarter and 26.85 per cent for the month of June alone, driven substantially by merchandise imports surging 31 per cent year on year. The result is a trade deficit that has widened sharply, from $2.89 billion in June 2025 to $15.32 billion in June 2026, and from $20.85 billion to $37.42 billion for the quarter.
For the logistics sector, this is a double signal. Rising exports across engineering goods, electronics and gems and jewellery point to sustained demand for freight and specialised handling. The sharper rise in imports, particularly from Taiwan, Russia, China and the USA, signals growing inbound volumes that ports and logistics networks will need to absorb. The widening deficit reflects an economy importing capital goods at a pace consistent with expanding production, placing added pressure on India’s logistics infrastructure.
Source: Ministry of Commerce and Industry, Department of Commerce, Government of India, PIB Release dated 13 July 2026.