The Ministry of Commerce & Industry has reported that India’s cumulative overall exports for the period of April to November 2024 are estimated at USD 536.25 billion, marking a growth of 7.61% compared to USD 498.33 billion in the same period of 2023. This positive trend underscores the resilience and expansion of India’s trade activities.
Merchandise exports: Steady growth
In the realm of merchandise exports, the cumulative value from April to November 2024 was USD 284.31 billion, showing a modest growth of 2.17% from USD 278.26 billion in the previous year.
Non-Petroleum exports:
- November 2024: Valued at USD 28.40 billion, a 7.75% increase from USD 26.36 billion in November 2023.
- April-November 2024: Cumulative value of USD 239.70 billion, up 7.38% from USD 223.24 billion in the same period of 2023.
Additionally, the non-petroleum merchandise exports in April-November 2024 exceeded the record of USD 233 billion set in April-November 2022.
Non-Petroleum & Non-Gems & Jewellery Exports:
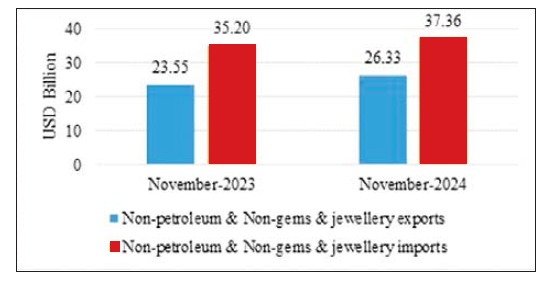
- Increased by 11.79% to USD 26.33 billion in November 2024 from USD 23.55 billion in November 2023.
Key drivers of export growth
The growth in merchandise exports during November 2024 was significantly driven by:
- Electronic goods: increased by 54.72% from USD 2.24 billion in November 2023 to USD 3.47 billion in November 2024.
- Engineering goods: up by 13.75% from USD 7.82 billion to USD 8.90 billion.
- Rice: Soared by 95.18% from USD 0.59 billion to USD 1.14 billion.
- Marine products: grew by 17.82% from USD 0.64 billion to USD 0.76 billion.
- RMG of all textiles: rose by 9.81% from USD 1.02 billion to USD 1.12 billion.
Comprehensive trade data for November 2024
The table below provides a snapshot of India’s trade figures for November 2024:
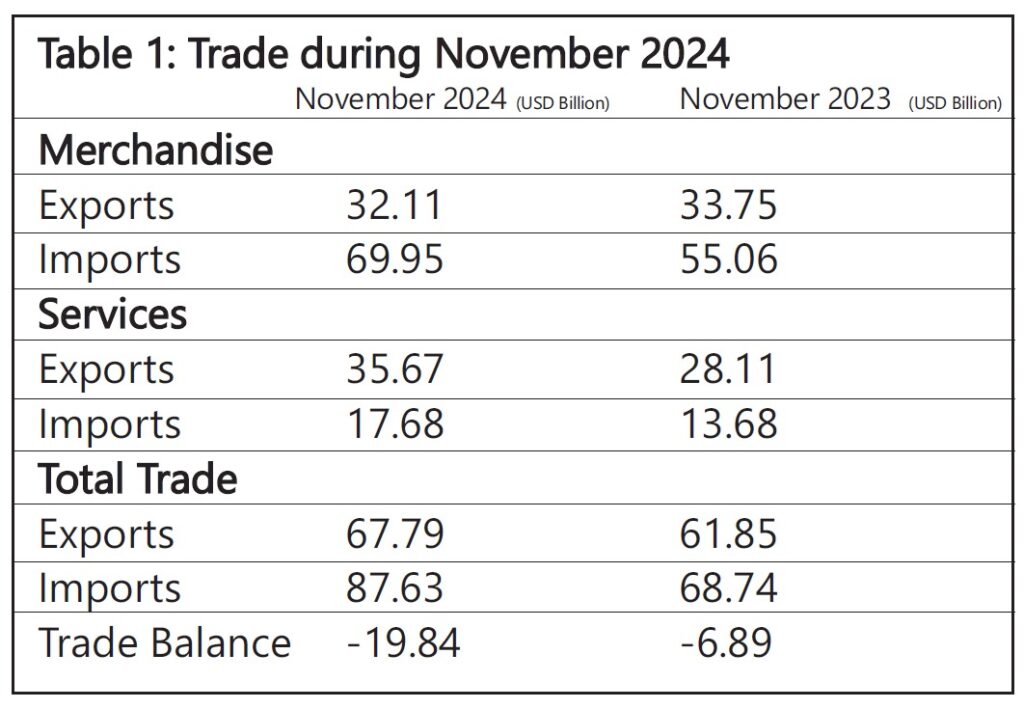
Note: The latest data for the services sector released by RBI is for October 2024. The data for November 2024 is estimated and will be revised based on RBI’s subsequent release. Data for April-November 2023 and April-June 2024 has been revised on a pro-rata basis using quarterly balance of payments data.
Overall trade performance for April-November 2024
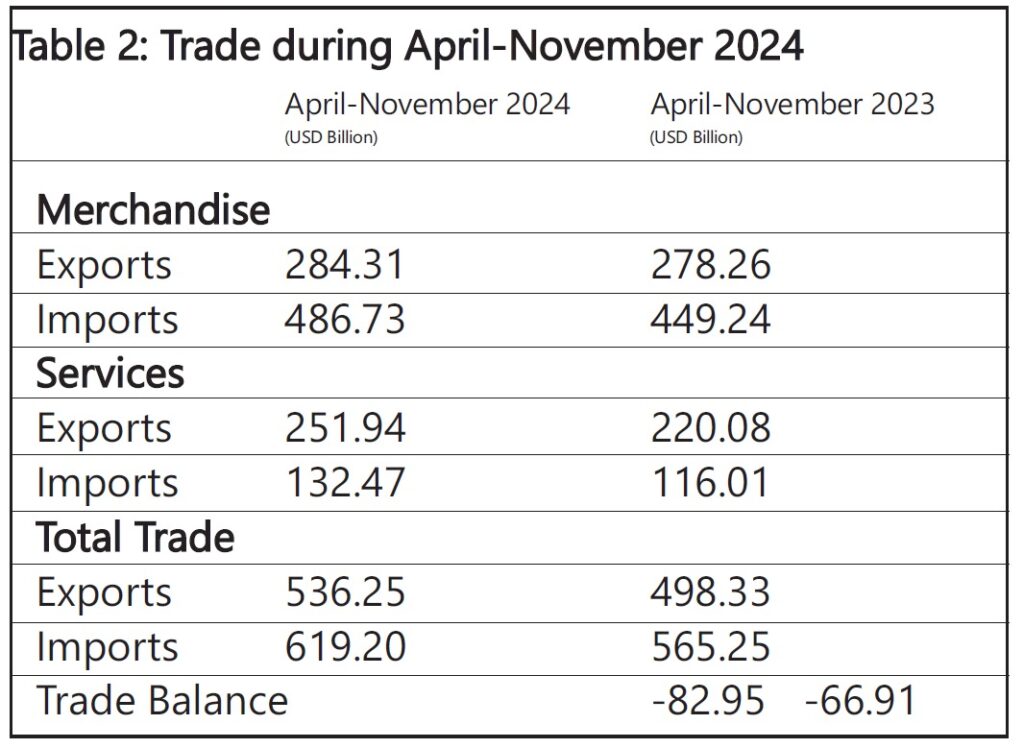
India’s total exports (merchandise and services combined) for April-November 2024 are estimated at USD 536.25 billion, reflecting a growth of 7.61%. Total imports for the same period are estimated at USD 619.20 billion, indicating a growth of 9.55%.
Merchandise trade insights
In November 2024, merchandise exports stood at USD 32.11 billion, while imports were USD 69.95 billion. For the April-November period, merchandise exports totalled USD 284.31 billion, with imports amounting to USD 486.73 billion, leading to a merchandise trade deficit of USD 202.42 billion.
Fig 3: Merchandise Trade during November 2024

Excluding petroleum and gems & jewellery trade
Table 3: Trade excluding Petroleum and Gems & Jewellery during November 2024
| November 2024 (USD Billion) | November 2023 (USD Billion) | |
| Non-petroleum exports | 28.40 | 26.36 |
| Non-petroleum imports | 53.84 | 40.13 |
| Non-petroleum & Non-Gems & Jewellery exports | 26.33 | 23.55 |
| Non-petroleum & Non-Gems & Jewellery imports | 37.36 | 35.20 |
Fig.: Trade excluding Petroleum and Gems & Jewellery during November 2024
Services trade overview
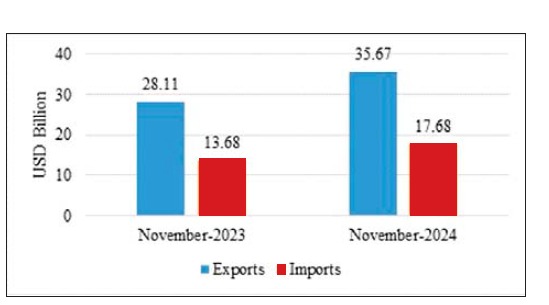
The estimated value of services exported for November 2024 is USD 35.67 billion, a significant increase from USD 28.11 billion in November 2023. Services imports are estimated at USD 17.68 billion, compared to USD 13.68 billion the previous year.
Fig 7: Services Trade during November 2024
Trade data by country
Top 5 export destinations (November 2024 vs. November 2023):
- United Arab Emirates: 11.38% growth
- Australia: 64.38% growth
- Italy: 37.71% growth
- Singapore: 22.88% growth
- Malaysia: 27.31% growth
Top 5 export destinations (April-November 2024 vs. April-November 2023):
- United Arab Emirates: 15.25% growth
- Netherlands: 23.04% growth
- USA: 5.27% growth
- Singapore: 20.7% growth
- UK: 15.21% growth
Top 5 import sources (November 2024 vs. November 2023):
- Switzerland: 360.02% growth
- United Arab Emirates: 109.57% growth
- South Africa: 217.33% growth
- Australia: 71.91% growth
- Saudi Arabia: 35.64% growth
Top 5 import sources (April-November 2024 vs. April-November 2023):
- United Arab Emirates: 60.84% growth
- China PRP: 9.81% growth
- Russia: 9.22% growth
- Switzerland: 21.83% growth
- Taiwan: 42.82% growth
Challenges and opportunities
Despite an expanded trade deficit of USD 82.95 billion for April-November 2024, India’s export growth highlights opportunities for enhancing competitiveness in high-performing sectors like electronic goods, engineering products, and agricultural commodities such as rice. Strategic partnerships, targeted policy support, and technological advancements can further bolster India’s global trade footprint.
Key challenges include addressing the trade deficit by fostering domestic manufacturing capabilities and diversifying import sources. The government’s focus on the Production-Linked Incentive (PLI) scheme and export promotion initiatives aims to mitigate these challenges.
Summary
India’s trade sector demonstrated robust growth in exports and imports across various categories during April-November 2024. The increase in exports of electronic goods, engineering goods, rice, marine products, and textiles significantly contributed to this growth. Meanwhile, the overall trade balance remains a critical area of focus, given the rising import figures.
India’s trade dynamics continue to evolve, driven by strategic initiatives and resilient performance across key sectors. Stay tuned for more updates as we monitor these trends.


